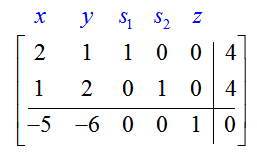
I am creating a problem where a student sets up an initial simplex tableau and I am having trouble getting the correct formatting answer matrix. In particular, I want to put column labels on top of a 3 x 6 grid filled with answer blanks. Ideally, it'd look like (image taken from https://math-faq.com/wp/chapter-4/section-4-3/section-4-3-question-3/):

but with the numbers replaced by answer blanks for students to enter and the variables do not need to be blue. My attempt at this is below. However, I do not like it because I am manually adding space for the labels. Any suggestions are greatly appreciated!
DOCUMENT();

loadMacros(
    "PGstandard.pl",
    "MathObjects.pl",
    "PGML.pl",
    "niceTables.pl",
    "PGmatrixmacros.pl",
    "PGchoicemacros.pl",
);

TEXT(beginproblem());

Context("Numeric");
Context()->variables->add(y=>"Real");
Context()->flags->set(tolerance => 0, tolType => "absolute");
Context()->noreduce('(-x)-y','(-x)+y');

@n = (1..9)[shuffle(9)];
$Px = non_zero_random(2,29);
$Py = non_zero_random(2,29);
$drhs1 = random(2,20);
$drhs2 = random(2,20);
$dlhs1 = Formula("$n[0] x + $n[1] y")->reduce;
$dlhs2 = Formula("$n[2] x + $n[3] y")->reduce;

Context()->texStrings;
$LP = DataTable(
    [
        ["Objective:", "\(\quad\) Maximize \(P = $Px x + $Py y\)"],
        ["Subject to:", "\(\quad\) \($dlhs1 \le $drhs1 \)"],
        ["", "\(\quad\) \($dlhs2 \le $drhs2 \)"],,
        ["", "\(\quad\) \(x \ge 0\), \(y \ge 0\)"],
    ],
    center => 0,
    align => 'lc',
);
Context()->normalStrings;

$dmat1 = DataTable(
    [
        ['\(\qquad\quad\quad\quad\quad x \)',
         '\(\qquad\qquad\qquad\qquad\qquad y\)',
         '\(\qquad\qquad\qquad\qquad\quad\quad s_1\)',
         '\(\qquad\qquad\qquad\qquad\quad\quad s_2\)',
         '\(\qquad\qquad\qquad\qquad\quad\quad P\)',
         '\(\qquad\qquad\qquad\qquad \mbox{constant}\) ']
    ],
    center => 0,
    align => 'c c c c c c',
);

$dlbrack = "\(\begin{array}{c} \\\ \\\ \\\ \end{array} \left[ \begin{array}{c} \\\ \\\ \\\ \\\ \\\ \end{array}\right. \)";
$drbrack = "\(\begin{array}{c} \\\ \\\ \\\ \end{array} \left. \begin{array}{c} \\\ \\\ \\\ \\\ \\\ \end{array}\right] \)";
$dmat2 = mbox($dlbrack,DataTable(
    [
        [ans_rule(10),ans_rule(10),ans_rule(10),ans_rule(10),ans_rule(10),ans_rule(10)],
        [ans_rule(10),ans_rule(10),ans_rule(10),ans_rule(10),ans_rule(10),[ans_rule(10),midrule=>1]],
        [ans_rule(10),ans_rule(10),ans_rule(10),ans_rule(10),ans_rule(10),ans_rule(10)]
    ],
    center => 0,
    align => 'c c c c c | c',
),$drbrack);

$dmat = DataTable(
    [
        [$dmat1],[$dmat2]
    ],
    center => 0,
    align => 'c',
);

BEGIN_PGML

Set up the initial simplex tableau corresponding to the following linear program.

[@ $LP @]***

[@ mbox($dmat) @]***

END_PGML

ANS(Compute($n[0])->cmp());
ANS(Compute($n[1])->cmp());
ANS(Compute(1)->cmp());
ANS(Compute(0)->cmp());
ANS(Compute(0)->cmp());
ANS(Compute($drhs1)->cmp());

ANS(Compute($n[2])->cmp());
ANS(Compute($n[3])->cmp());
ANS(Compute(0)->cmp());
ANS(Compute(1)->cmp());
ANS(Compute(0)->cmp());
ANS(Compute($drhs2)->cmp());

ANS(Compute(-$Px)->cmp());
ANS(Compute(-$Py)->cmp());
ANS(Compute(0)->cmp());
ANS(Compute(0)->cmp());
ANS(Compute(1)->cmp());
ANS(Compute(0)->cmp());

ENDDOCUMENT();