1) Any idea on how would one test whether the "alttext" for the graph
in the problem below is working? (Here at UM they are very concerned about accessibility issues).
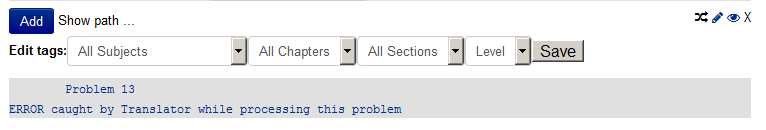
2) I'm not sure how to interpret the error (see attachment)
I got when "testing the randomization" of the following problem:
# DESCRIPTION
# Recognizing values of the parameters k and p from the graph of y=k x^p (with p<0)
# ENDDESCRIPTION
#Right now stored at MAA-PREP2015
# Homework/Workshop3/Souza/problem4.pg
## DBsubject(’Precalculus’)
## DBchapter(’’)
## DBsection(’’)
## Date(’mm/dd/15’)
## Level(’’)
## Keywords(’’)
## Author(’Regina Souza’)
## Institution(’University of Montana, Missoula’)
## TitleText1(’Functions Modeling Change’)
## EditionText1(5)
## AuthorText1(’Connally’)
## Section1(11.1)
## Problem1()
DOCUMENT();
loadMacros("PGstandard.pl",
"MathObjects.pl",
"PGgraphmacros.pl",
"parserPopUp.pl",
"PGML.pl",
"PGcourse.pl");
Context("Numeric");
#Context()->variables->add(t => "Real");
TEXT(beginproblem());
$showPartialCorrectAnswers = 1;
$refreshCachedImages = 1;
Context("Numeric");
$pixels = 200;
# Create the canvas
$gr = init_graph(-1,-1,6,6, # xmin, ymin, xmax, ymax
axes=>[0,0], grid=>[7,7], size=>[$pixels, $pixels]);
$gr -> lb('reset'); # remove default labels
# axes labels
$gr->lb( new Label(5.5,0,'x', 'black', 'center', 'bottom'));
$gr->lb( new Label(0.1,5.5,'y', 'black', 'left', 'middle'));
# axes labels
foreach my $i (1..5) {
$gr->lb( new Label($i,0, $i, 'black', 'center', 'top'));
$gr->lb( new Label(-0.1,$i, $i, 'black', 'right', 'middle'));
}
# randomize the graph
$c = random(2,4,0.5);
# plot a function
$f = Formula("$c/x");
add_functions($gr, "$f for x in <0,6> using color:blue and weight:2");
install_problem_grader(~~&std_problem_grader);
$showPartialCorrectAnswers = 0;
$popup1 = PopUp(
["choose","a linear function","a quadratic function","an exponential function","a power function"],
"a power function",
);
$popup2 = PopUp(
["choose","0","1","2","2.5","3","3.5","4.0"],
"$c",
);
$popup3 = PopUp(
["choose","d is less than 0", "d is between 0 and 1", "d is greater than 1"],
"d is less than 0",
);
BEGIN_PGML
Consider the function given by the following graph:
>> [@ image(insertGraph($gr), width=>$pixels, height=>$pixels, tex_size=>900,extra_html_tags=>'alt="Graph of a decreasing, concave up function in quadrant I, which passes through (1,'.$c.') " ' ) @]*
[` f(x)=c\cdot x^d `] <<
a. Which type of function is this? This is [_________]{$popup1}
b. What is the value of [` c `] ? [` c = `][____]{$popup2}
c. Choose the best option for [` d `]: [_________]{$popup3}
END_PGML
BEGIN_PGML_SOLUTION
*SOLUTION*
a. This is [@ $popup1->correct_ans() @]* .
b. [` c = [$c] `], the value of the function at 1, and
c. [@ $popup3->correct_ans() @]* , since [` c>0 `] and the power function is decreasing when [` x>0 `].
END_PGML_SOLUTION
ENDDOCUMENT();
Forums
Search results: 163
Hi Gavin,
Augh! The smart vs dumb quote problem which i know but forgot.
Unfortunately i am still having problems in that I cant rename the file within the file manager.
I wanted to start over to see if I could start fresh with the process.
Here is what i attempted:
1.) I deleted the reference to the image within the *.pg file.
2.) I renamed the *.pg file.
Renamed it as: Hoffman_H21_2.pg
3.) I deleted the old directory holding the *.png image file and the old *.pg file.
4.) I refreshed the File manager.
5.) I created new folder with the same name:
Hoffman_21_2
6.) I refreshed the File manager.
7.) I attempt to rename the new updated *.pg file in an attempt to create a new folder called:
Hoffman_21_2/Hoffman_21_2.pg
But I consistently get this error message:
Can't rename file: No such file or directory
Can you see my glitch?
Thanks.
Hi,
When I ran your code, I received the error message:
        Problem1
ERROR caught by Translator while processing problem file:tmpEdit/Experimental/Popup_debug.pg.pearson.tmp
****************
ERRORS from evaluating PG file:
 The correct choice must be one of the PopUp menu items at line 2 of (eval 4648)
   Died within Value::Error called at line 100 of [PG]/macros/parserPopUp.pl
   from within parser::PopUp::new called at line 2 of (eval 4648)
   from within main::PopUp called at line 63 of (eval 4423)
which tells me that the correct answer is not among the choices listed in the PopUp. In particular, in the first popup you need "power function" to appear twice (once in the list of choices and once as the correct answer).
###### begin pg code ###########
$popup1 = PopUp(
["choose","linear","quadratic","exponential","power function"],
"power function",
);
###### end pg code ############
Similar remarks apply to the second popup. Also, there should be no space between the answer blank and the answer: it should be [____]{"2"} and not [____] {"2"}.
Best regards,
Paul Pearson
########### begin pg file ###############
DOCUMENT();
loadMacros("PGstandard.pl",
"MathObjects.pl",
"PGgraphmacros.pl",
"parserPopUp.pl",
"PGML.pl",
"PGcourse.pl");
Context("Numeric");
#Context()->variables->add(t => "Real");
#---------------------------------------------------------------------------------------------------------------------
# problem set-up section
#---------------------------------------------------------------------------------------------------------------------
#---------------------------------------------------------------------------------------------------------------------
# text section
#---------------------------------------------------------------------------------------------------------------------
TEXT(beginproblem());
$showPartialCorrectAnswers = 1;
$refreshCachedImages = 1;
Context("Numeric");
$pixels = 200;
# Create the canvas
$gr = init_graph(-3,-3,3,6, # xmin, ymin, xmax, ymax
axes=>[0,0], grid=>[6,9], size=>[$pixels, $pixels]);
$gr -> lb('reset'); # remove default labels
# axes labels
$gr->lb( new Label(2.5,0,'x', 'black', 'center', 'bottom'));
$gr->lb( new Label(0.1,5.5,'y', 'black', 'left', 'middle'));
# axes labels
foreach my $i (-2..2) {
$gr->lb( new Label($i,0, $i, 'black', 'center', 'top'));
}
foreach my $i (-2..5) {
$gr->lb( new Label(-0.1,$i, $i, 'black', 'right', 'middle'));
}
######
###### Maybe randomize the graph?
######
# plot a function
$f = Formula("2*sqrt(x)");
add_functions($gr, "$f for x in <-1,4> using color:blue and weight:2");
#########
### Problem worked up to here
#########
install_problem_grader(~~&std_problem_grader);
$showPartialCorrectAnswers = 0;
$popup1 = PopUp(
["choose","linear","quadratic","exponential","power function"],
"power function",
);
$popup2 = PopUp(
["choose","less than 0","between 0 and 1","greater than 1",],
"between 0 and 1",
);
BEGIN_PGML
>> [@ image(insertGraph($gr), width=>$pixels, height=>$pixels, tex_size=>900) @]*
[` f(x)=c\cdot x^d `] <<
a. Which type of function is this? [_________]{$popup1}
b. What is the value of [` c `] ? [` c = `] [____]{"2"}
c. Choose the best option for [` d `]: [__]{$popup2}
END_PGML
#---------------------------------------------------------------------------------------------------------------------
# (answer and) solution section
#---------------------------------------------------------------------------------------------------------------------
BEGIN_PGML_SOLUTION
*SOLUTION*
The correct answers are [@ $popup1->correct_ans() @]* , 2 (the value of the function at 1) and
[@ $popup2->correct_ans() @]* (since the power function is increasing and concave down).
END_PGML_SOLUTION
ENDDOCUMENT();
Question 1: Is there an intelligent solution to avoid the label zero on the axes when creating a graph (other than interrupting the counter)?
Question 2: What is wrong with my popups? Code follows:
#---------------------------------------------------------------------------------------------------------------------
# tagging and description section
#---------------------------------------------------------------------------------------------------------------------
# DESCRIPTION
# Recognizing properties of the parameters k and p from the graph of y=kx^p
# ENDDESCRIPTION
# Homework/Workshop3/Souza/problem3.pg
#---------------------------------------------------------------------------------------------------------------------
# initialization section
#---------------------------------------------------------------------------------------------------------------------
DOCUMENT();
loadMacros("PGstandard.pl",
"MathObjects.pl",
"PGgraphmacros.pl",
"parserPopUp.pl",
"PGML.pl",
"PGcourse.pl");
Context("Numeric");
#Context()->variables->add(t => "Real");
#---------------------------------------------------------------------------------------------------------------------
# problem set-up section
#---------------------------------------------------------------------------------------------------------------------
#---------------------------------------------------------------------------------------------------------------------
# text section
#---------------------------------------------------------------------------------------------------------------------
TEXT(beginproblem());
$showPartialCorrectAnswers = 1;
$refreshCachedImages = 1;
Context("Numeric");
$pixels = 200;
# Create the canvas
$gr = init_graph(-3,-3,3,6, # xmin, ymin, xmax, ymax
axes=>[0,0], grid=>[6,9], size=>[$pixels, $pixels]);
$gr -> lb('reset'); # remove default labels
# axes labels
$gr->lb( new Label(2.5,0,'x', 'black', 'center', 'bottom'));
$gr->lb( new Label(0.1,5.5,'y', 'black', 'left', 'middle'));
# axes labels
foreach my $i (-2..2) {
$gr->lb( new Label($i,0, $i, 'black', 'center', 'top'));
}
foreach my $i (-2..5) {
$gr->lb( new Label(-0.1,$i, $i, 'black', 'right', 'middle'));
}
######
###### Maybe randomize the graph?
######
# plot a function
$f = Formula("2*sqrt(x)");
add_functions($gr, "$f for x in <-1,4> using color:blue and weight:2");
#########
### Problem worked up to here
#########
install_problem_grader(~~&std_problem_grader);
$showPartialCorrectAnswers = 0;
$popup1 = PopUp(
["choose","linear","quadratic","exponential"],
"power function",
);
$popup2 = PopUp(
["choose","d less than 0","d greater than 1"],
"d between 0 and 1",
);
BEGIN_PGML
>> [@ image(insertGraph($gr), width=>$pixels, height=>$pixels, tex_size=>900) @]*
[` f(x)=c\cdot x^d `] <<
a. Which type of function is this? [_________]{$popup1}
b. What is the value of [` c `] ? [` c = `] [____] {2}
c. Choose the best option for [` d `]: [@ $popup2->menu() @]*
END_PGML
ANS( $popup2->cmp() );
#---------------------------------------------------------------------------------------------------------------------
# (answer and) solution section
#---------------------------------------------------------------------------------------------------------------------
BEGIN_PGML_SOLUTION
*SOLUTION*
The correct answers are [@ $popup1->correct_ans() @]* , 2 (the value of the function at 1) and
[@ $popup2->correct_ans() @]* (since the power function is increasing and concave down).
END_PGML_SOLUTION
ENDDOCUMENT();
Hi Gary,
This has been on my personal annoyance list since the very first semester I used WeBWorK. Since WeBWorK only plots N points on the domain you specify, one way to get more samples is to plot the function in two (or more) parts. For instance, the code below plots the function $f on -10 <= x <= 0 and again on 0 <= x <= 10 and achieves a pretty good looking result.
###### begin PG code ###########
$f = Formula("3*sin(2*pi/3 * (x - 1)) + 3");
add_functions($gr, "$f for x in <-10,0> using color:blue and weight:2");
add_functions($gr, "$f for x in <0,10> using color:blue and weight:2");
###### end PG code ###########
Another, more complicated, option would be to generate the plot points yourself and connect them by line segments. This is illustrated in the code below.
###### begin PG code ##########
$g = Formula("3*sin(2*pi/3 * (x - 1)) - 3");
@x = map { $_/10 } (-100..100); # take the integers from -100 to 100 and divide them each by 10
#@y = map { $g->eval(x=>$_) } @x; # this works, but the perlFunction on the next line should be faster
@y = map { &{$g->perlFunction}($_) } @x; # evaluate the function g at the points in @x
$gr -> moveTo( $x[0], $y[0] ); # move the plotting cursor
foreach my $i (1..$#x) { $gr->lineTo($x[$i],$y[$i],'red',2); } # connecting line segments
###### end PG code ############
I have included a complete PG file below with both of these options plotted. The file displays to the student some of the properties of @x and @y, which I used as a means for debugging.
Best regards,
Paul Pearson
############### begin PG file ###############
DOCUMENT();
loadMacros(
"PGstandard.pl",
"MathObjects.pl",
"PGgraphmacros.pl",
"PGML.pl",
"AnswerFormatHelp.pl",
"PGcourse.pl",
);
TEXT(beginproblem());
$showPartialCorrectAnswers = 1;
$refreshCachedImages = 1;
Context("Point");
$pix = 400;
# Create the canvas
#$pixels=>[2000,2000];
$gr = init_graph(-10,-10,10,10, # xmin, ymin, xmax, ymax
axes=>[0,0], grid=>[20,20], size=>[$pix,$pix]);
$gr -> lb('reset'); # remove default labels
# axes labels
$gr->lb( new Label(9.5,0,'x', 'black', 'center', 'bottom'));
$gr->lb( new Label(0.1,9.5,'y', 'black', 'left', 'middle'));
# axes labels
foreach my $i (-10..10) {
$gr->lb( new Label($i,0, $i, 'black', 'center', 'top'));
$gr->lb( new Label(-0.1,$i, $i, 'black', 'right', 'middle'));
}
# plot a function
$d = random(-9,9,1);
if (abs($d - 10) < abs($d + 10)) {
$a = random(0.5, abs($d - 10), 0.5); }
else {
$a = random(0.5, abs($d + 10), 0.5); }
$b = random(0.5,5,0.5);
$c = random(0,$b,0.25);
#$f = Formula("$a*sin(2*pi/$b * (x - $c)) + $d");
$f = Formula("3*sin(2*pi/3 * (x - 1)) + 3");
add_functions($gr, "$f for x in <-10,0> using color:blue and weight:2");
add_functions($gr, "$f for x in <0,10> using color:blue and weight:2");
$g = Formula("3*sin(2*pi/3 * (x - 1)) - 3");
@x = map { $_/10 } (-100..100);
#@y = map { $g->eval(x=>$_) } @x; # this works, but the perlFunction on the next line should be faster
@y = map { &{$g->perlFunction}($_) } @x;
$gr -> moveTo( $x[0], $y[0] );
foreach my $i (1..$#x) { $gr->lineTo($x[$i],$y[$i],'red',2); }
$answer = Point("(0,$b)");
BEGIN_PGML
+ length of @x: [@ scalar(@x); @]*
+ x-values: [@ join(', ' , @x) @]*
+ length of @y: [@ scalar(@y); @]*
+ y-values: [@ join(', ' , @y) @]*
[%What are the coordinates of the vertex of the parabola in the graph?
[____________]{$answer} [@ AnswerFormatHelp("points") @]*%]
>> [@ image(insertGraph($gr), width=>$pix, height=>$pix, tex_size=>800) @]*
A sine graph. <<
END_PGML
COMMENT("MathObject version. Uses PGML.");
ENDDOCUMENT();
############### end PG file #####################
Hello,

I'm trying to create a problem using graphs. I can get my graph (a sine function) to plot but it is "janky"; not enough points are chosen for the plot to create a nice smooth graph (see below). Is there any way to increase the number of points chosen in the domain to get a smoother graph?
Here's my code for the problem:
DOCUMENT();
loadMacros(
"PGstandard.pl",
"MathObjects.pl",
"PGgraphmacros.pl",
"PGML.pl",
"AnswerFormatHelp.pl",
"PGcourse.pl",
);
TEXT(beginproblem());
$showPartialCorrectAnswers = 1;
$refreshCachedImages = 1;
Context("Point");
$pix = 400;
# Create the canvas
#$pixels=>[2000,2000];
$gr = init_graph(-10,-10,10,10, # xmin, ymin, xmax, ymax
axes=>[0,0], grid=>[20,20], size=>[$pix,$pix]);
$gr -> lb('reset'); # remove default labels
# axes labels
$gr->lb( new Label(9.5,0,'x', 'black', 'center', 'bottom'));
$gr->lb( new Label(0.1,9.5,'y', 'black', 'left', 'middle'));
# axes labels
foreach my $i (-10..10) {
$gr->lb( new Label($i,0, $i, 'black', 'center', 'top'));
$gr->lb( new Label(-0.1,$i, $i, 'black', 'right', 'middle'));
}
# plot a function
$d = random(-9,9,1);
if (abs($d - 10) < abs($d + 10)) {
$a = random(0.5, abs($d - 10), 0.5); }
else {
$a = random(0.5, abs($d + 10), 0.5); }
$b = random(0.5,5,0.5);
$c = random(0,$b,0.25);
#$f = Formula("$a*sin(2*pi/$b * (x - $c)) + $d");
$f = Formula("3*sin(2*pi/3 * (x - 1)) + 3");
add_functions($gr, "$f for x in <-10,10> using color:blue and weight:2");
$answer = Point("(0,$b)");
BEGIN_PGML
[%What are the coordinates of the vertex of the parabola in the graph?
[____________]{$answer} [@ AnswerFormatHelp("points") @]*%]
>> [@ image(insertGraph($gr), width=>$pix, height=>$pix, tex_size=>800) @]*
A sine graph. <<
END_PGML
COMMENT("MathObject version. Uses PGML.");
ENDDOCUMENT();
I am trying to write a problem about measurement.
Using the multianswer parser I can access only the last "original_student_ans"
The pared-down code is below. hp
DOCUMENT();
loadMacros(
"PGbasicmacros.pl",
"MathObjects.pl",
"PGanswermacros.pl",
"parserMultiAnswer.pl",
);
#######################
TEXT($BEGIN_ONE_COLUMN,beginproblem()) ;
$refreshCachedImages = 1;
$showPartialCorrectAnswers = 1;
###############
$H = 0.43;
$W = 5.57;
$A = $H*$W;
$P = 2*$H + 2*$W;
$multians = MultiAnswer($H, $W, $A, $P)->with(
singleResult => 0,
checker => sub {
my ( $correct, $student, $self, $answer_hash_reference ) = @_;
my %ansH = %$answer_hash_reference;
@keys = keys %ansH;
foreach(0..@keys){
$strkeys = $strkeys.$keys[$_]." ";
}
my ($H_stu, $W_stu, $A_stu, $P_stu ) = @{$student};
# my ($H_oa, $W_oa, $A_oa, $P_oa )= @{$ansH} {original_student_ans};# unsuccessful
$H_n = Nsigfig($ansH{original_student_ans}); #last entry only one available
my ( $H_correct, $W_correct, $A_correct, $P_correct) = @{$correct};
$A_correct = $H_stu*$W_stu;
$P_correct = 2*$H_stu+2*$W_stu;
$self->setMessage(1,"number sigfigs for last only $H_n ");
$self->setMessage(2, $strkeys );
$self->setMessage(3,$W_oa);
$self->setMessage(4,$ansH{original_student_ans});
if($H_n ==3){
return [1,1,1,1]}
else {
return [0,0,0,0];
}
}
);
BEGIN_TEXT
Record the horizontal dimension. \{$multians->ans_rule(10)\} $BR
Record the vertical dimension. \{$multians->ans_rule(10)\} $BR
Calculate the area. \{$multians->ans_rule(10)\} $BR
Calculate the perimeter. \{$multians->ans_rule(10)\} $BR
END_TEXT
ANS($multians->cmp() );
sub Nsigfig{
($x) = @_;
$_=$x;
if (m/./){
$xPlus = $x."1";
$n =int ( ln($xPlus/($xPlus-$x))/ln(10) );}
else {#tba
}
return $n;
}
TEXT($END_ONE_COLUMN);
ENDDOCUMENT();
I don't know whether this is a problem with WW, or just with my server, but a problem it is: when I first log in to WW, and start to create a homework set, I can bring up a page of problems from the OPL very quickly. However, if I wish to choose some different problems - or even the next page of problems, my system takes ages to refresh the page, and sometimes just hangs with an error message.
This means that what should be a simple task (selecting 10 integration problems, say, for an elementary calculus set), can take well over an hour, with all the waits, the crashes, the logging out and back in.
Is this a known issue for anybody - and is there a work-around?
This means that what should be a simple task (selecting 10 integration problems, say, for an elementary calculus set), can take well over an hour, with all the waits, the crashes, the logging out and back in.
Is this a known issue for anybody - and is there a work-around?
I"m trying to use dynamic graphics to display a series of graphs - real and imaging parts of a discrete complex function. I need to find the min and max of the solutions in order to set the limits on the graphs. I think I have this down using min(@vector) and max(@vector). I"m having difficulty on (at least) two points plotting the discrete points, I try
$point1[0] = closed_circle(n_vec[0],$alpha_re[0], 'red');
which give a syntax error I cannot find. The vectors n_vec and alpha_re are defined and used elsewhere.
commenting those lines out, I get an error at line 137
136		$graph_re[$j] -> stamps($point1[0],$point1[1]);
137		$fig_re[$j] = image(insertGraph($graph_re[$j]),width => 240,height => 180,tex_size => 200);
a divide by zero. I thought this would be problems with the computed limits. But I'm having difficulty displaying the limits, since program bombs. How do I find the offending values?
Thanks
DOCUMENT(); # This should be the first executable line in the problem.
loadMacros(
"PGstandard.pl",
"MathObjects.pl",
"AnswerFormatHelp.pl",
"PGgraphmacros.pl",
"unionTables.pl",
"PGanswermacros.pl",
"PGchoicemacros.pl",
"PGgraphmacros.pl",
"extraAnswerEvaluators.pl",
"parserCustomization.pl",
"PGcourse.pl"
);
TEXT(beginproblem());
$refreshCachedImages = 1;
Context("Complex");
Context()->variables->are(
n=>"Real",
t=>"Real"
);
Context()->flags->set(
tolerance => 0.001,
tolType => "absolute",
);
$Tover2 = random(5,10,1);
$T = 2*$Tover2;
$d0 = random(2,$T-4,1);
$t0 = -$Tover2 + $d0;
$d1 = random(1, $Tover2-$t0-2, 1);
$t1 = $t0 + $d1;
$d2 = random(1,$Tover2-$t1-1,1);
$t2 = $t1 + $d2;
$w0 = 2*pi/$T;
$a1 = non_zero_random(-6, 6, 1);
do {$a2 = non_zero_random(-6, 6, 1);} until ($a2 != $a1);
$FSeries = Formula("(1/$T)*(i*($a1/($w0*n))*(exp((-1)*i*$w0*$t1*n) - exp((-1)*i*$w0*$t0*n)) + i*($a2/($w0*n))*(exp((-1)*i*$w0*$t2*n) - exp((-1)*i*$w0*$t1*n)) ) ")->reduce;
$N = 6;
$indx = -1;
for ($k=-$N, $k<= $N,$k++) {
$indx++;
if ($k == 0) {$alpha[$indx] = Compute(($d1*$a1 + $d2*$a2)/$T); }
else {
$alpha[$indx] = $FSeries -> eval(n=>$k);
};
$alpha_mag[$indx] = abs($alpha[$indx] );
$alpha_ph[$indx] = arg($alpha[$indx] );
$alpha_re[$indx] = Re($alpha[$indx] );
$alpha_im[$indx] = Im($alpha[$indx] );
$n_vec[$indx] = $k;
};
#$alpha0m = Compute(abs($alpha0));
#$alpha0p = Compute(0);
#if ($alpha0 < 0) {$alpha0p = pi;}
# check back for adding pi for correct quadrant
#$f_approx = Formula(" $alpha0 + 2*$alphap1m*cos($w0*t + $alphap1p) + 2*$alphap2m*cos($w0*2*t + $alphap2p) ")->reduce;
### generate graphics
$a = random(1,9,1);
$b = random(2,1,9);
$c = random(2,1,9);
$n_min = -($N+1);
$n_max = ($N+1);
$grid_n = $n_max - $n_min;
$Fmag_min = Compute(min(@alpha_mag));
$Fph_min = (-1)*pi;
$Fmag_max = Compute(max(@alpha_mag));
$Fph_max = pi;
$Fre_min = Compute(min(@alpha_re));
$Fim_min = Compute(min(@alpha_im));
$Fre_max = Compute(max(@alpha_re));
$Fim_max = Compute(max(@alpha_im));
$grid_mag = $Fmag_max - $Fmag_min; # limits are same for real and imag parts
$grid_ph = $Fph_max - $Fph_min; # limits are same for real and imag parts
$grid_re = $Fre_max - $Fre_min; # limits are same for real and imag parts
$grid_im = $Fim_max - $Fim_min; # limits are same for real and imag parts
#$orig = image(insertGraph($gr),width => 400,height => 300,tex_size => 600);
# generate functions
# insert functions into graph
for ($j = 0; $j <=5; $j++) {
$graph_re[$j] = init_graph($n_min,$Fre_min,$n_max,$Fre_max,'axes'=>[0,0],'grid'=>[$grid_n,$grid_re] );
$graph_im[$j] = init_graph($n_min,$Fim_min,$n_max,$Fim_max,'axes'=>[0,0],'grid'=>[$grid_n,$grid_im] );
};
# set labels in graphs
for ($j = 0; $j <=5; $j++) {
$graph_re[$j]->lb('reset');
$graph_re[$j]->lb(new Label(-0.5,0,0,'black','right','middle'));
$graph_re[$j]->lb(new Label(-0.5,($Fre_max-1),($Fre_max-1),'black','right','middle'));
for ($i = 0; $i <= ($n_max-1); $i++) { if ($i != 0) {
$graph_re[$j]->lb(new Label($i,-.5,$i,'black','center','top')) }};
$graph_re[$j]->lb(new Label(-.5,($Fre_max/2),"Fre",'black','right','top'));
$graph_re[$j]->lb(new Label(($n_max/2),-0.5,"n",'black','right','bottom'));
#plot_functions( $graph_re[$j], $real[$j]);
#$point1[0] = closed_circle(n_vec[0],$alpha_re[0], 'red');
#$point1[1] = closed_circle(n_vec[1],$alpha_re[1], 'red');
$point1[0] = closed_circle(-1,1, 'red');
$point1[1] = closed_circle(1,2, 'red');
$graph_re[$j] -> stamps($point1[0],$point1[1]);
$fig_re[$j] = image(insertGraph($graph_re[$j]),width => 240,height => 180,tex_size => 200);
$graph_im[$j]->lb('reset');
$graph_im[$j]->lb(new Label(-0.5,0,0,'black','right','middle'));
$graph_im[$j]->lb(new Label(-0.5,($Fim_max-1),($Fim_max-1),'black','right','middle'));
for ($i = 0; $i <= ($w_max-1); $i++) { if ($i != 0) {
$graph_im[$j]->lb(new Label($i,-.5,$i,'black','center','top')) }};
$graph_im[$j]->lb(new Label(-.5,($Fim_max/2),"Im(F)",'black','right','top'));
$graph_im[$j]->lb(new Label(($n_max/2),-0.5,"n",'black','right','bottom'));
#plot_functions( $graph_im[$j], $imag[$j]);
#$point2[0] = closed_circle(n_vec[0],$alpha_im[0], 'blue');
#$point2[1] = closed_circle(n_vec[1],$alpha_im[1], 'blue');
$point1[0] = closed_circle(-1,1, 'red');
$point1[1] = closed_circle(1,2, 'red');
$graph_im[$j] -> stamps($point2[0],$point2[1]);
$fig_im[$j] = image(insertGraph($graph_im[$j]),width => 240,height => 180,tex_size => 200);
};
$mc = new_multiple_choice();
$mc->qa('Sketch accurate graphs of the real and imaginary parts of this function, \( Real(F(n)) \) and \( Imag(F(n) )\) , for integers \( n \in [-$N, $N] \). Which (if any) of the graphs below matches the graph you drew?','Real $fig_re[0] Imag $fig_im[0] $BR $BITALIC(click on image to enlarge)$EITALIC ');
$mc->extra('Real $fig_re[1] Imag $fig_im[1] $BR $BITALIC(click on image to enlarge)$EITALIC',
'Real $fig_re[2] Imag $fig_im[2] $BR $BITALIC(click on image to enlarge)$EITALIC',
'Real $fig_re[3] Imag $fig_im[3] $BR $BITALIC(click on image to enlarge)$EITALIC',
'Real $fig_re[4] Imag $fig_im[4] $BR $BITALIC(click on image to enlarge)$EITALIC',
'Real $fig_re[5] Imag $fig_im[5]$BR $BITALIC(click on image to enlarge)$EITALIC');
$mc->makeLast('None of the above');
Context()->texStrings;
BEGIN_TEXT
Graphing discrete complex functions, e.g., Fourier series
$PAR
Consider the periodic function with period \( $T \) given by
$BR
\[ f(t) = \left\lbrace \begin{array}{ l l } 0 & \mbox{ if } -$Tover2 \leq t < $t0 \\ $a1 & \mbox{ if } $t0 \leq t < $t1 \\
$a2 & \mbox{ if } $t1 \leq t < $t2 \\
0 & \mbox{ if } $t2 \leq t < $Tover2. \end{array} \right. \]
$PAR
Find and plot the first $N coefficients of the exponential Fourier Series for \( f(t) \), i.e., \( F(n) \) for \( n = -$N, ... 0, ... $N.\)
$BR
\{ $mc->print_q() \} $BR
\{ $mc->print_a() \}
END_TEXT
Context()->normalStrings;
ANS(radio_cmp($mc->correct_ans));
## force a refresh of the image after changes
ENDDOCUMENT(); # This should be the last executable line in the problem.
You might try moving the
$refreshCachedImages = 1 to earlier in the problem. Currently, it is after the image is referenced the problem. I'm not sure when it has its effect, but I suspect the image is created and linked in at the point where the image is referenced, and that is probably where the value of $refreshCachedImages is used. Changing it afterword would have no effect in that case.