WeBWorK performance
Contents
The timing log
The timing_log_check.pl is available in webwork2/bin and parses the timing log data found in webwork2/logs/timing.log.
To run the script, cd to the WeBWorK logs directory (usually /opt/webwork/webwork2/logs)
and enter the command: timing_log_check.pl
Data
- From the
courses1.webwork.maa.orgtiming log:
Data from January 6, 2014 to September 4, 2012
count = 12479615
under 0.1 seconds = 6202643: 49.7%
between 0.1 and 0.2 seconds = 4575120: 36.7%
between 0.2 and 0.5 seconds = 1495042: 12%
between 0.5 and 1.0 seconds = 115930: 0.9%
between 1.0 and 2.0 seconds = 56915: 0.5%
between 2.0 and 3.0 seconds = 15674: 0.1%
between 3.0 and 4.0 seconds = 5789: 0%
between 4.0 and 5.0 seconds = 3230: 0%
between 5.0 and 10.0 seconds = 5214: 0%
over 10.0 seconds = 4058: 0%
non valid response = 0: 0%
- From the
courses.webwork.maa.orgtiming log:
Data from September 2012
count = 2612898
under 0.1 seconds = 1807850: 69.2%
between 0.1 and 0.2 seconds = 414769: 15.9%
between 0.2 and 0.5 seconds = 356358: 13.6%
between 0.5 and 1.0 seconds = 15600: 0.6%
between 1.0 and 2.0 seconds = 12624: 0.5%
between 2.0 and 3.0 seconds = 3912: 0.1%
between 3.0 and 4.0 seconds = 781: 0%
between 4.0 and 5.0 seconds = 361: 0%
between 5.0 and 10.0 seconds = 429: 0%
over 10.0 seconds = 214: 0%
non valid response = 0: 0%
Data from July 2010 - August 2011
count = 13427151
under 0.1 seconds = 7999616: 59.6%
between 0.1 and 0.2 seconds = 2864257: 21.3%
between 0.2 and 0.5 seconds = 1955285: 14.6%
between 0.5 and 1.0 seconds = 297585: 2.2%
between 1.0 and 2.0 seconds = 135471: 1%
between 2.0 and 3.0 seconds = 45002: 0.3%
between 3.0 and 4.0 seconds = 23265: 0.2%
between 4.0 and 5.0 seconds = 13663: 0.1%
between 5.0 and 10.0 seconds = 30677: 0.2%
over 10.0 seconds = 62330: 0.5%
non valid response = 0: 0%
- From the
courses.webwork.maa.orgtiming log:
Data from September 8, 2011 - January 10, 2012
count = 7064845
under 0.1 seconds = 3947249: 55.9%
between 0.1 and 0.2 seconds = 1555935: 22%
between 0.2 and 0.5 seconds = 1284348: 18.2%
between 0.5 and 1.0 seconds = 186063: 2.6%
between 1.0 and 2.0 seconds = 56870: 0.8%
between 2.0 and 3.0 seconds = 14858: 0.2%
between 3.0 and 4.0 seconds = 6172: 0.1%
between 4.0 and 5.0 seconds = 3051: 0%
between 5.0 and 10.0 seconds = 5597: 0.1%
over 10.0 seconds = 4702: 0.1%
non valid response = 0: 0%
Note: The daily backup routine was moved from 12 midnight (a busy time for students to do work) to 6:00am. This seems to have resulted if fewer operations taking a long time.
- From the Rochester server
math.webwork.rochester.edutiming log:
Data from September 6, 2011 count = 2586
under 0.1 seconds = 1795: 69.4%
between 0.1 and 0.2 seconds = 223: 8.6%
between 0.2 and 0.5 seconds = 515: 19.9%
between 0.5 and 1.0 seconds = 36: 1.4%
between 1.0 and 2.0 seconds = 8: 0.3%
between 2.0 and 3.0 seconds = 8: 0.3%
between 3.0 and 4.0 seconds = 1: 0%
between 4.0 and 5.0 seconds = 0: 0%
between 5.0 and 10.0 seconds = 0: 0%
over 10.0 seconds = 0: 0%
non valid response = 0: 0%
webwork.math.missouri.edu
May 5, 2010 to Oct 10, 2011
Server: 32 bit freebsd 7.2 vm with 4GB of ram serving 1200-1400 students per semester
count = 4664624
under 0.1 seconds = 3696211: 79.2%
between 0.1 and 0.2 seconds = 536336: 11.5%
between 0.2 and 0.5 seconds = 363331: 7.8%
between 0.5 and 1.0 seconds = 48816: 1%
between 1.0 and 2.0 seconds = 13498: 0.3%
between 2.0 and 3.0 seconds = 2865: 0.1%
between 3.0 and 4.0 seconds = 1406: 0%
between 4.0 and 5.0 seconds = 666: 0%
between 5.0 and 10.0 seconds = 1036: 0%
over 10.0 seconds = 459: 0%
non valid response = 0: 0%
Note: This server had two "out of memory" events which brought the server down due to a freebsd kernel setting that we should have tweaked but didn't until we understood the problem. This isn't a concern with the linux kernel or 64bit freebsd machines. These two events probably account for most of the requests on the high end.
February 02, 2012 - May 22, 2012
Server: FreeBSD 8.2-RELEASE-p2 amd64, Intel Xeon Processor E5520, 16GB RAM
About 2300 users in SP12 Semester
count = 1438276
under 0.1 seconds = 1007856: 70.1%
between 0.1 and 0.2 seconds = 217355: 15.1%
between 0.2 and 0.5 seconds = 179686: 12.5%
between 0.5 and 1.0 seconds = 25465: 1.8%
between 1.0 and 2.0 seconds = 5565: 0.4%
between 2.0 and 3.0 seconds = 902: 0.1%
between 3.0 and 4.0 seconds = 375: 0%
between 4.0 and 5.0 seconds = 227: 0%
between 5.0 and 10.0 seconds = 345: 0%
over 10.0 seconds = 500: 0%
non valid response = 0: 0%
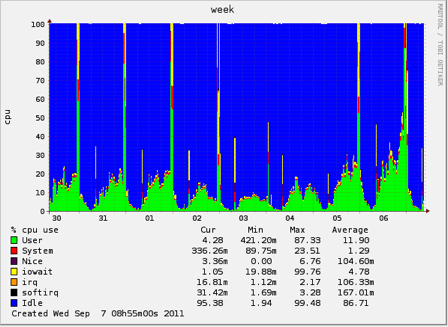
Results from load monitoring software
Webmin on courses.maa.org
External Links
- http://en.wikipedia.org/wiki/RRDtool
- Comments on Munin from Saruna Burdulis at Dartmouth. image
- http://www.webalizer.org/ - Another monitoring option
