WeBWorK performance
Contents
The timing log
The timing_log_check.pl is available in /opt/webwork/webwork2/bin and parses the timing log data found in /opt/webwork/webwork2/logs/timing.log.
Note that this only looks at the current timing.log. If the timing.log is being rotated, modify the script to parse data in older logs which may be compressed.
Older logs are also found in /opt/webwork/webwork2/logs/.
To run the script, cd to the WeBWorK logs directory (usually /opt/webwork/webwork2/logs)
and enter the command: timing_log_check.pl
Data
- From the
courses1.webwork.maa.orgtiming log:
Data from January 6, 2014 to September 4, 2014
count = 12479615
under 0.1 seconds = 6202643: 49.7%
between 0.1 and 0.2 seconds = 4575120: 36.7%
between 0.2 and 0.5 seconds = 1495042: 12%
between 0.5 and 1.0 seconds = 115930: 0.9%
between 1.0 and 2.0 seconds = 56915: 0.5%
between 2.0 and 3.0 seconds = 15674: 0.1%
between 3.0 and 4.0 seconds = 5789: 0%
between 4.0 and 5.0 seconds = 3230: 0%
between 5.0 and 10.0 seconds = 5214: 0%
over 10.0 seconds = 4058: 0%
non valid response = 0: 0%
- From the
courses.webwork.maa.orgtiming log:
Data from September 2012
count = 2612898
under 0.1 seconds = 1807850: 69.2%
between 0.1 and 0.2 seconds = 414769: 15.9%
between 0.2 and 0.5 seconds = 356358: 13.6%
between 0.5 and 1.0 seconds = 15600: 0.6%
between 1.0 and 2.0 seconds = 12624: 0.5%
between 2.0 and 3.0 seconds = 3912: 0.1%
between 3.0 and 4.0 seconds = 781: 0%
between 4.0 and 5.0 seconds = 361: 0%
between 5.0 and 10.0 seconds = 429: 0%
over 10.0 seconds = 214: 0%
non valid response = 0: 0%
Data from July 2010 - August 2011
count = 13427151
under 0.1 seconds = 7999616: 59.6%
between 0.1 and 0.2 seconds = 2864257: 21.3%
between 0.2 and 0.5 seconds = 1955285: 14.6%
between 0.5 and 1.0 seconds = 297585: 2.2%
between 1.0 and 2.0 seconds = 135471: 1%
between 2.0 and 3.0 seconds = 45002: 0.3%
between 3.0 and 4.0 seconds = 23265: 0.2%
between 4.0 and 5.0 seconds = 13663: 0.1%
between 5.0 and 10.0 seconds = 30677: 0.2%
over 10.0 seconds = 62330: 0.5%
non valid response = 0: 0%
- From the
courses.webwork.maa.orgtiming log:
Data from September 8, 2011 - January 10, 2012
count = 7064845
under 0.1 seconds = 3947249: 55.9%
between 0.1 and 0.2 seconds = 1555935: 22%
between 0.2 and 0.5 seconds = 1284348: 18.2%
between 0.5 and 1.0 seconds = 186063: 2.6%
between 1.0 and 2.0 seconds = 56870: 0.8%
between 2.0 and 3.0 seconds = 14858: 0.2%
between 3.0 and 4.0 seconds = 6172: 0.1%
between 4.0 and 5.0 seconds = 3051: 0%
between 5.0 and 10.0 seconds = 5597: 0.1%
over 10.0 seconds = 4702: 0.1%
non valid response = 0: 0%
Note: The daily backup routine was moved from 12 midnight (a busy time for students to do work) to 6:00am. This seems to have resulted if fewer operations taking a long time.
- From the Rochester server
math.webwork.rochester.edutiming log:
Data from September 6, 2011 count = 2586
under 0.1 seconds = 1795: 69.4%
between 0.1 and 0.2 seconds = 223: 8.6%
between 0.2 and 0.5 seconds = 515: 19.9%
between 0.5 and 1.0 seconds = 36: 1.4%
between 1.0 and 2.0 seconds = 8: 0.3%
between 2.0 and 3.0 seconds = 8: 0.3%
between 3.0 and 4.0 seconds = 1: 0%
between 4.0 and 5.0 seconds = 0: 0%
between 5.0 and 10.0 seconds = 0: 0%
over 10.0 seconds = 0: 0%
non valid response = 0: 0%
webwork.math.missouri.edu
May 5, 2010 to Oct 10, 2011
Server: 32 bit freebsd 7.2 vm with 4GB of ram serving 1200-1400 students per semester
count = 4664624
under 0.1 seconds = 3696211: 79.2%
between 0.1 and 0.2 seconds = 536336: 11.5%
between 0.2 and 0.5 seconds = 363331: 7.8%
between 0.5 and 1.0 seconds = 48816: 1%
between 1.0 and 2.0 seconds = 13498: 0.3%
between 2.0 and 3.0 seconds = 2865: 0.1%
between 3.0 and 4.0 seconds = 1406: 0%
between 4.0 and 5.0 seconds = 666: 0%
between 5.0 and 10.0 seconds = 1036: 0%
over 10.0 seconds = 459: 0%
non valid response = 0: 0%
Note: This server had two "out of memory" events which brought the server down due to a freebsd kernel setting that we should have tweaked but didn't until we understood the problem. This isn't a concern with the linux kernel or 64bit freebsd machines. These two events probably account for most of the requests on the high end.
February 02, 2012 - May 22, 2012
Server: FreeBSD 8.2-RELEASE-p2 amd64, Intel Xeon Processor E5520, 16GB RAM
About 2300 users in SP12 Semester
count = 1438276
under 0.1 seconds = 1007856: 70.1%
between 0.1 and 0.2 seconds = 217355: 15.1%
between 0.2 and 0.5 seconds = 179686: 12.5%
between 0.5 and 1.0 seconds = 25465: 1.8%
between 1.0 and 2.0 seconds = 5565: 0.4%
between 2.0 and 3.0 seconds = 902: 0.1%
between 3.0 and 4.0 seconds = 375: 0%
between 4.0 and 5.0 seconds = 227: 0%
between 5.0 and 10.0 seconds = 345: 0%
over 10.0 seconds = 500: 0%
non valid response = 0: 0%
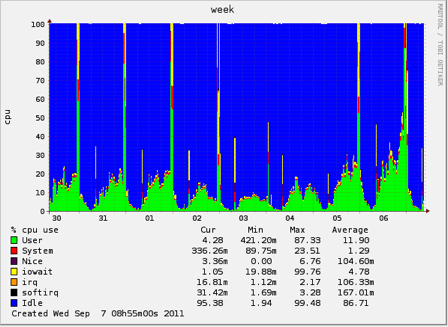
Results from load monitoring software
Webmin on courses.maa.org
External Links
- http://en.wikipedia.org/wiki/RRDtool
- Comments on Munin from Saruna Burdulis at Dartmouth. image
- http://www.webalizer.org/ - Another monitoring option
