Hi all,
I am trying to embed an interactive Desmos graph into a webwork problem using the Desmos API. The problem I have is that when the "algebra expressions panel" in the Desmos graph (the part of the graph that has y=(x^h-1)/h, h=-1, and "powered by Desmos" in the attached picture) is enabled, then the buttons on the page do not work. If I disable the "algebra expressions panel", then the graph loses its interactive sliders.
Case 1 (algebra expressions panel enabled): When I set "expressions: true" in the PG code below, the "algebra expressions" panel is displayed in the Desmos graph but the Submit Answers button and other buttons on the page stop working (clicking them causes no action). Clicking Submit Answers generates the following error message in the JavaScript console:
WorkerPool: allowed to use 8 workers.calculator.js:23 spawned worker 1 of 1(index):1 An invalid form control with name='' is not focusable.
Case 2 (algebra expressions panel disabled): When I set "expressions: false" in the PG code below, the "algebra expressions" panel disappears from the Desmos graph and the Submit Answers button and other buttons on the page work as expected. In this case, I have lost the interactive features I wanted.
So, JavaScript gurus out there, can you help me with this? What is it about enabling the "algebra expressions panel" that breaks the Submit Answers and other buttons on the page?
Thank you in advance for your help!
Paul Pearson
###############################
# Initialization
DOCUMENT();
loadMacros(
"PGstandard.pl",
"MathObjects.pl",
"AnswerFormatHelp.pl",
"unionTables.pl",
"contextInequalities.pl",
#"PGcourse.pl",
);
TEXT(beginproblem());
$showPartialCorrectAnswers = 1;
################################
# Desmos setup
#
# In html mode, load the Desmos api script and create the <div> to attach the Desmos graph to.
# In tex mode, print a message to direct the student to the html version.
# Desmos API reference: https://www.desmos.com/api/v0.6/docs/index.html
$unique_div_id = "calculator_question_1_paul_pearson";
$width = 600;
$height = 400;
HEADER_TEXT(MODES(
HTML=>'<script src="https://www.desmos.com/api/v0.6/calculator.js?apiKey=dcb31709b452b1cf9dc26972add0fda6"></script>',
TeX=>''
));
$desmos_div = MODES(
HTML=>qq(<div id="$unique_div_id" style="width: ${width}px; height: ${height}px;"></div>),
TeX=>'Interactive graph best viewed online'
);
################################
# Setup
Context("Inequalities")->variables->are(h=>'Real', x=>'Real');
$ans1 = Compute("h < 1");
$ans2 = Compute("ln(x)");
################################
# Main text
Context()->texStrings;
BEGIN_TEXT
\{
ColumnTable(
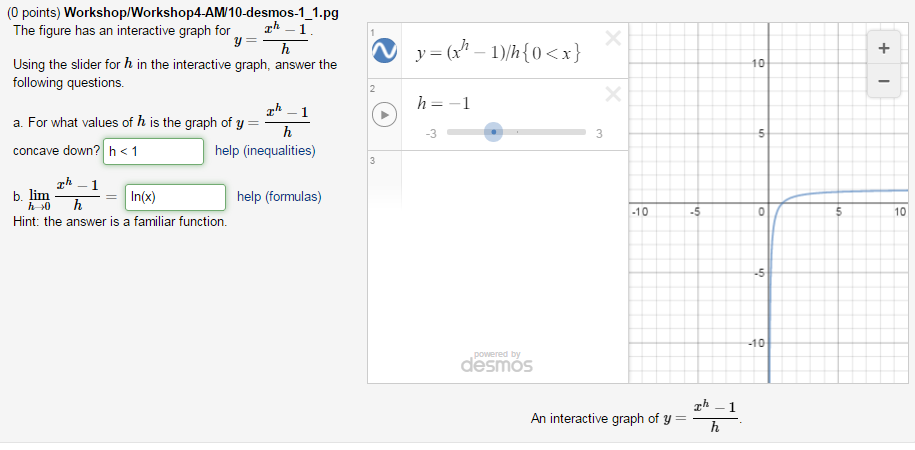
"The figure has an interactive graph for \( \displaystyle y = \frac{x^h-1}{h} \).
Using the slider for \( h \) in the interactive graph, answer the following questions.".
$PAR.
"a. For what values of \( h \) is the graph of \( \displaystyle y = \frac{x^h-1}{h} \) concave down?".
ans_rule(10).$SPACE.AnswerFormatHelp("inequalities").
$PAR.
"b. \( \displaystyle \lim_{h \to 0} \frac{x^h-1}{h} = \) ".
ans_rule(10).$SPACE.AnswerFormatHelp("formulas").
$BR.
"Hint: the answer is a familiar function."
,
$desmos_div.
$BR.
$BCENTER.
"An interactive graph of \( \displaystyle y = \frac{x^h-1}{h} \).".
$ECENTER
,
indent => 0, separation => 30, valign => "TOP"
)
\}
END_TEXT
Context()->normalStrings;
ANS($ans1->cmp);
ANS($ans2->cmp);
##################################
# Desmos graph (via the API)
# Execute this only after the $desmos_div object has been put on the html page.
TEXT( MODES(TeX=>'', HTML=><<END_SCRIPT ) );
<script>
<!-- //
var elt = document.getElementById("$unique_div_id");
var calculator = Desmos.Calculator(elt, {
keypad: false,
//expressions: false,
expressions: true,
settingsMenu: false,
expressionsTopbar: false
});
calculator.setExpressions([
//{ id: 'h', latex: 'h=2', sliderBounds: { min: -2, max: 2, step: 0.01} },
{ id: 'curve1', latex: 'y=(x^h-1)/h \\left\\{0<x\\right\\}', color: Desmos.Colors.BLUE },
{ id: 'slider1', latex: 'h=-1', sliderBounds: {min: -3, max: 3, step: 0.01}}
]);
// -->
</script>
END_SCRIPT
COMMENT('MathObject version. Uses Desmos interactive JavaScript graphing which should work on all devices in html mode.');
ENDDOCUMENT();