I have run in to the following issue. I have created dynamicimages for the below problem. Each of the exponential portions renders correctly, but some extra information gets added to the graph in some cases (see attached).
When I re-seed, the issue sometimes appears and sometimes does not. I know that I could alter the domain for the functions, but this doesn't really solve the issue. I have also messed around with different steps in the graph (using ($gr->fn)[0]->steps(2000);), but this doesn't fix it either.
Here is my code. Can anybody view a problem?
Thanks!
James
## DESCRIPTION
## Algebra, Exponential functions
## ENDESCRIPTION
## DBsubject()
## DBchapter()
## DBsection()
## Date(06/26/2017)
## Institution(Colorado Community College System)
## Author(James Morski)
## Static(1)
## MO(1)
## KEYWORDS('algebra','exponential functions')
###########################
# Initialization
DOCUMENT();
loadMacros(
"PGstandard.pl",
"MathObjects.pl",
"PGchoicemacros.pl",
"parserAssignment.pl",
"AnswerFormatHelp.pl",
"PGML.pl",
"PGgraphmacros.pl",
"parserPopUp.pl",
"PGcourse.pl",
"contextLimitedPoint.pl",
);
TEXT(beginproblem());
$showPartialCorrectAnswers = 1;
##########################
# Setup
$a=random(-5,-2,1);
$b=random(.15,.85,.1);
$c=random(1,5,1);
$d=random(1,5,1);
$gr = init_graph(-10,-10,10,10,
axes=>[0,0],
grid=>[10,10],
size=>[600,600]
);
$gr1 = init_graph(-10,-10,10,10,
axes=>[0,0],
grid=>[10,10],
size=>[600,600]
);
$gr2 = init_graph(-10,-10,10,10,
axes=>[0,0],
grid=>[10,10],
size=>[600,600]
);
$gr3 = init_graph(-10,-10,10,10,
axes=>[0,0],
grid=>[10,10],
size=>[600,600]
);
$gr4 = init_graph(-10,-10,10,10,
axes=>[0,0],
grid=>[10,10],
size=>[600,600]
);
add_functions($gr, "($a($b)^x) for x in <-10,10>" .
" using color:blue and weight:2");
add_functions($gr1, "($a($b)^(x+$c)-$d) for x in <-10,10>" .
" using color:blue and weight:2");
add_functions($gr2, "(-$a($b)^(x)-$c) for x in <-10,10>" .
" using color:blue and weight:2");
add_functions($gr3, "($a($b)^(x-$d)-$c) for x in <-10,10>" .
" using color:blue and weight:2");
add_functions($gr4, "($a($b)^(x+$d)+$c) for x in <-10,10>" .
" using color:blue and weight:2");
Context("Numeric");
$popup1 = PopUp(
["?","A","B", "C", "D"], "C",
);
$popup2 = PopUp(
["?","x","y"], "y",
);
$fun=("$a($b)^x");
$ans1=("$a($b)^(x+$d)+$c");
$ans2 = ("$c");
#################################
# Main text
BEGIN_PGML
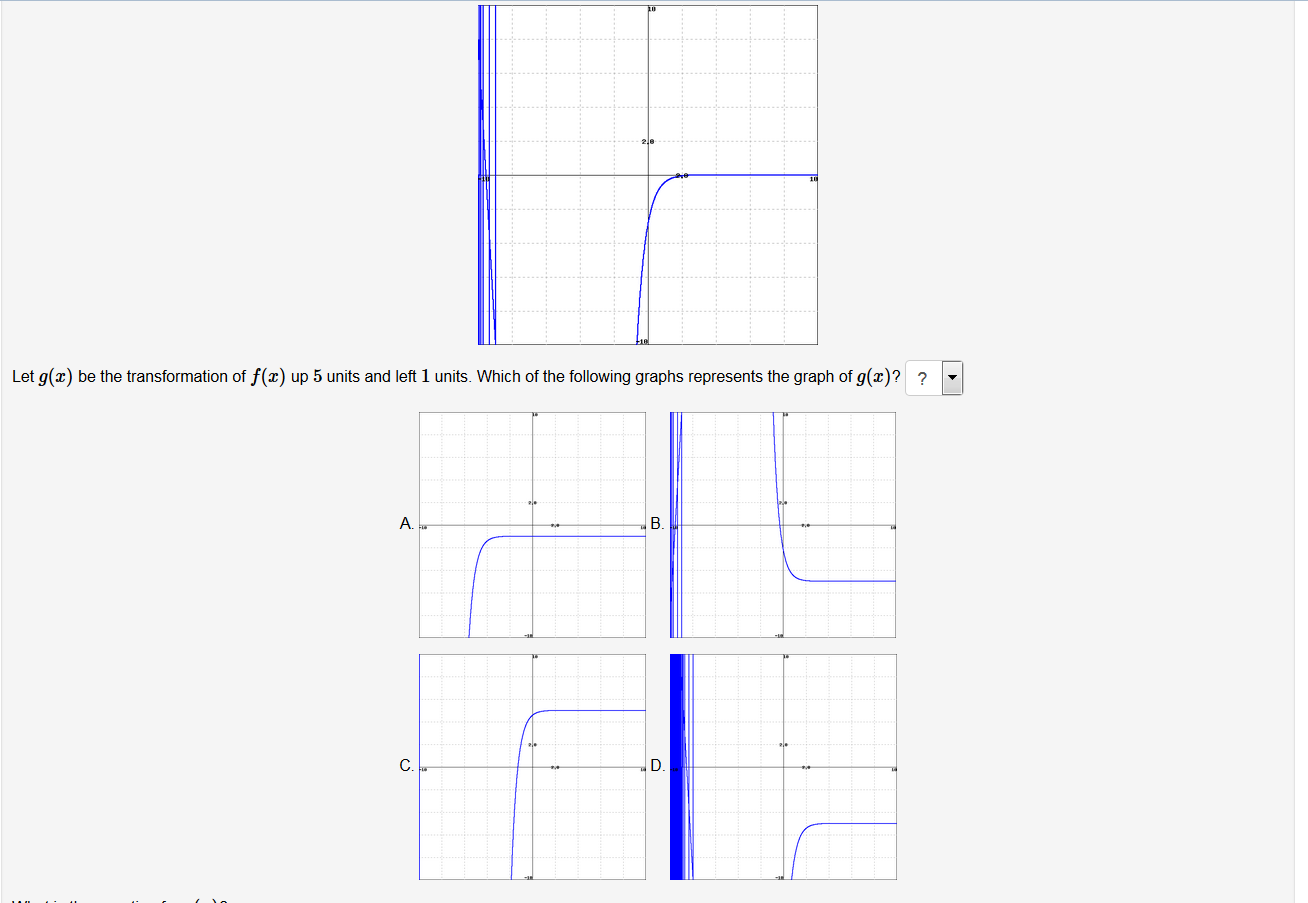
The graph of `f(x)=[$fun]` is given below (click on graph to enlarge):
>>[@ image(insertGraph($gr), width=>300, height=>300), @]*<<
Let `g(x)` be the transformation of `f(x)` up `[$c]` units and left `[$d]` units. Which of the following graphs represents the graph of `g(x)`? [_________________]{$popup1}
>>A. [@ image(insertGraph($gr1), width=>200, height=>200), @]* B. [@ image(insertGraph($gr2), width=>200, height=>200), @]* <<
>>C. [@ image(insertGraph($gr4), width=>200, height=>200), @]* D. [@ image(insertGraph($gr3), width=>200, height=>200), @]* <<
What is the equation for `g(x)`?
>>`g(x)`= [_________________]{$ans1} [@ AnswerFormatHelp("formulas") @]*<<
What is the horizontal asymptote of `g(x)`? Enter the equation of a line.
>>[_________________]{$popup2}=[_________________]{$ans2}<<
END_PGML
#################################
# Solution
#BEGIN_PGML_SOLUTION
#Solution explanation goes here.
#END_PGML_SOLUTION
COMMENT('Uses PGML.');
ENDDOCUMENT();