http://webwork.maa.org/wiki/DynamicImages#.XH5VI3X7SGA
#####################################
DOCUMENT();
loadMacros(
"PGgraphmacros.pl",
"PGstandard.pl",
);
$gr1 = init_graph(-3,-2,3,2,axes=>[0,0],grid=>[6,4]);
$gr1->lb('reset');
add_functions($gr1,
"sin(x) for x in <-3,3> using color:black and weight:2");
BEGIN_TEXT
\{ image( insertGraph($gr1), tex_size=>250 ) \}
END_TEXT
ENDDOCUMENT();
###############################################################
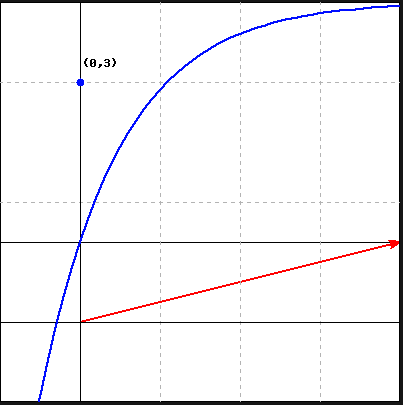
For which I would expect a sin graph plotted from x range (-3,3) and yrange (-2,2) I get the attached image.
Is there something obvious that I am missing?
Thanks in advance for any help
Zak