Can parserGraphTool.pl be adapted for a one-dimensional plotting exercise? These would be exercises where the things to plot would be a finite collection of points and intervals on a number line. Intervals might be infinite on one or both ends.
I have though about that. I have several problems that ask the student to solve a linear inequality or compound linear inequality, and then graph it. The first part is a standard MathObject interval answer, but for the graph I use a radio multiple choice type answer. It would certainly be nicer to have the students construct the number line graph instead.
In addition, these problems are scaffold problems where the second graph part is not visible until after the first part is correct. The reason for this is because the multiple choice graphs give away what the solutions for the equality are. In addition, I have to have alternate version of the problems on quizzes that do not ask the graph part, because the scaffold is open and again the graph gives information away for working the first part. If the student were constructing the graph from scratch, this wouldn't be an issue.
I actually use JSXGraph for the graphs in the multiple choice radio answers, but they are static graphs. Sp JSXGraph is certainly capable of making these sorts of graphs. However, the graphTool javascript would need considerable retooling to achieve this, and that would be difficult to do without messing up the two dimensional graphing capabilities. It might be easier to make another macro and javascript to handle this.
Here is a screenshot of a graph from one of these problems: 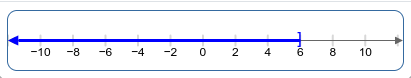
Well, it seems that you can already do a one dimensional graph. The guy that designed the graph tool made it rather versatile. Smart guy. Anyway, attached is an example of a problem that asks a student to graph a number on the number line.
It should be possible to tweak the existing graph tool macro and javascript to make this easier to do. In addition, a new interval tool could be created that could be used to graph intervals on the number line. It would need an accompanying tool for selecting when an endpoint is open or closed, and probably options to use brackets and parentheses to show those points, or open and closed dots. I assume others may want open or closed dots. I use brackets and parenthesis because the text the course uses also does so.
It should be possible to tweak the existing graph tool macro and javascript to make this easier to do. In addition, a new interval tool could be created that could be used to graph intervals on the number line. It would need an accompanying tool for selecting when an endpoint is open or closed, and probably options to use brackets and parentheses to show those points, or open and closed dots. I assume others may want open or closed dots. I use brackets and parenthesis because the text the course uses also does so.
An option will be needed to not show a particular axis to make this look good. When testing the attached problem I hardcoded the y-axis removal into the graphtool.js file.
That is neat. If I understand right, just making one dimension of the viewing window so small, it is effectively one-dimensional.
Ultimately I think I want to try to make a tool more intentionally designed as a 1-D plotting tool. It would have two types of point tools (hollow dot and filled dot. analogous to dashed and solid lines in 2D). And the "fill" tool would fill intervals as you would expect it to, instead of 2D regions. I think I'd rather not get into all the options for making line segments for (a,b), (a,b], [a,b), [a,b], (-∞,b), (-∞,b], (a,∞), and [a,∞). The two point tools and a fill tool would be enough.
Ultimately I think I want to try to make a tool more intentionally designed as a 1-D plotting tool. It would have two types of point tools (hollow dot and filled dot. analogous to dashed and solid lines in 2D). And the "fill" tool would fill intervals as you would expect it to, instead of 2D regions. I think I'd rather not get into all the options for making line segments for (a,b), (a,b], [a,b), [a,b], (-∞,b), (-∞,b], (a,∞), and [a,∞). The two point tools and a fill tool would be enough.
Basically, the y-range is chosen so that with the default y snap value of 1, the only horizontal line in the range is the x-axis. So when JSXGraph snaps to coordinates, the only options are the points on the x-axis.
Implementing this in the way you suggest would be very challenging. JSXGraph is really a two dimensional graphing library, and filling between points would be difficult. The fill would have to really be interpreted into a line segment. Furthermore, JSXGraph doesn't actually even support filling between curves, much less between points. The fill tool that the graph tool currently has was one of the most challenging things to implement.
I was thinking instead that there would be two interval tools. One a bounded interval tool, and one an unbounded interval tool. Both tools would work much like the current line tool. You start by plotting one endpoint, and then by plotting the other. For the bounded interval tool, when the second point is plotted, the interval would end. For the unbounded interval tool, plotting the second point would really be more like choosing a direction. Paired with this there would be another tool that is much like the current solid/dashed tool for curves, except it would be an open/closed endpoint (or hollow/filled dot) tool. With this approach it takes care of all of the options for making line segments for (a,b), (a,b], etc if one wanted to use that sort of interval as opposed to open/closed dots.
If I tried my hand at making these tools, should they go into the repo, or should they use the generic extension capabilities of graphTool?
I am about to make a pull request that also does this. I didn't know you were going to work on it.
I implemented it sort of how I described. Although I only made one interval tool. The ends of the board are interpreted as points at infinity. Moving a point to those ends turns it into an arrow indicating continuation.