WeBWorK Main Forum

Interactive graphics

Interactive graphics

by Joel Trussell -
Number of replies: 12
have been fascinated by some interactive graphics written using either JavaScript or GeoGebra.


unfortunately, learning how to construct such applications is difficult for me. I'd appreciate some help pointing me in the right direction for the novice that I am.

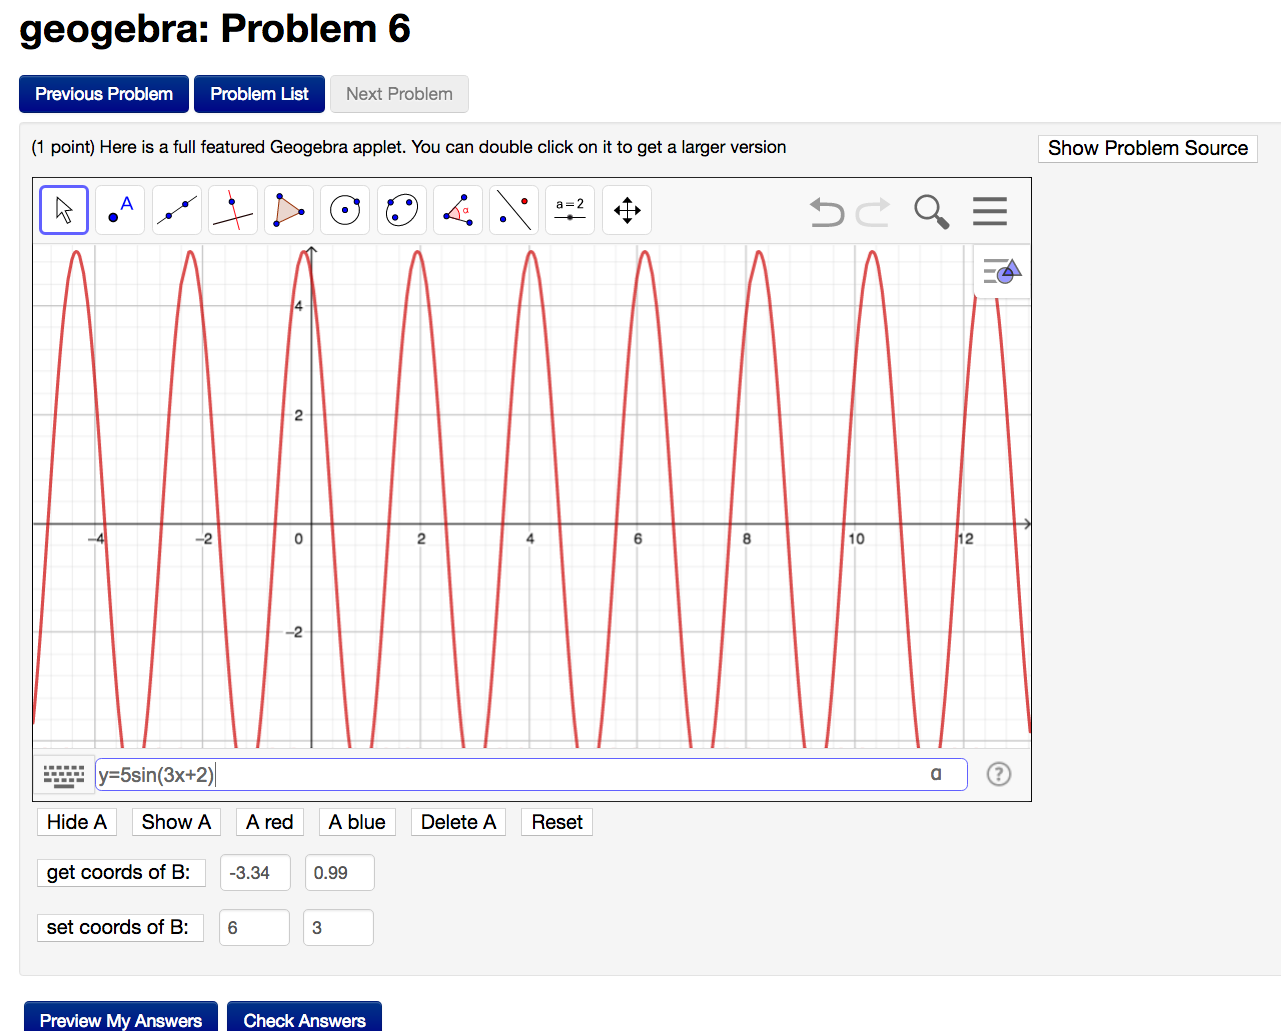
A big hurdle for many of the ECE instructors for using Webwork is the lack of the capability to draw/sketch a waveform, It is common to ask the students to draw/sketch the output of a system given a known input, e.g., a sine wave of frequency f, phase p and amplitude a. The example of the draw derivative from CSU shows the ability to draw a curve free hand and compare it to a given answer.
I suspect that the same capability is available in GeoGebra.

I'd like to construct a simple example of having the student sketch a sinusoid of a given frequency and compare it to the actual function - using the simplest possible method.

Is this reasonably easy to do with appropriate learning? And if so, can you point me in the right direction? I've got a couple of TA who are better than I at coding but I need to know how to do this, too.
In reply to Joel Trussell

Re: Interactive graphics

by Paul Pearson -
Hi Joel,

Sounds interesting.  I don't think GeoGebra has the ability to take freehand drawings as input.  A javascript solution is probably best for browser compatibility and being accessible on as many kinds of devices as possible.  I'm wondering if we could extend sketch.js ( http://intridea.github.io/sketch.js/ ) or a similar program.

I can foresee a few options for how to process the freehand drawing:
  1. (Worst:) Pass the raw pixel coordinates for all the points to webwork, and have the webwork server process everything.

  2. (Better / Best?:) Pass the xy-coordinates for all the points to webwork, which would mean using javascript on the local machine to do the pixel to xy-coordinate conversion.  The webwork server would then process the xy-coordinates of the points, either by numerical comparison or by Fourier (or other) transforms to get a symbolic formula for comparison purposes.

  3. (Best, depending on application?:) Process everything in javascript in the local browser by converting from pixel coordinates, to xy-coordinates, to a symbolic formula all in the local browser.  Then, pass the symbolic formula to webwork.
I'd like to hear from the Cleveland State University folks to learn how their Flash applets processed the freehand drawing before moving forward, though.

Best regards,

Paul Pearson

In reply to Paul Pearson

Re: Interactive graphics

by Michael Gage -
You can also take a look at the examples at 
https://hosted2.webwork.rochester.edu/webwork2/UR104/Graphical_input/

The problems in that set 
  1. Example of HTML5 graphical input -- by David Gage
  2. Example of Flash applet graphical input -- sketch derivative -- from CSU
  3. Flash applet -- sketch anti-derivative -- from CSU
  4. Java applet -- uses nodes to adjust graph  -- this one by David Ecks is particularly interesting if you can enable java temporarily -- it allows graphing by moving "beads" up and down on coordinate lines -- it is much stabler than example (1) above which requires a VERY steady hand to input a good graph. -- that could undoubtedly be fixed in a revised edition. 
You can login as profa/profa  to get the professor view.  

The macro analyze graph is here: https://github.com/openwebwork/pg/blob/master/macros/PGanalyzeGraph.pl

and some of the other javascript code is here:

https://hosted2.webwork.rochester.edu/webwork2_course_files/2014_07_UR_demo/show-source.cgi/setDemo2/CanvasObject.pl

And the javascript guts of sketch are at 

https://hosted2.webwork.rochester.edu/webwork2_files/js/legacy/sketchgraphhtml5b/
   SketchGraph.html
   SketchGraph.pjs
   processing-dgfix.js

These are demo, proof of concept,  files that David Gage made 2 or 3 years ago so they should probably be updated.  It's possible that sketch.js could be plugged in in place of the current javascript. 

The processing is done entirely on the server when you press the submit button. 
That works for the example problem. It might not if you are trying to fourier transform
the input. 

There are a lot of javaScript libraries now including JSXgraph, D3.js, etc, etc,

Hope that give you some ideas.  If someone gets something going lets open it up and see
if we can make a solid macro for entering graphs that everyone can plugin to their problems

--Mike

In reply to Michael Gage

Re: Interactive graphics

by Joel Trussell -
I'm back to this problem. I haven't been able to find a good sketching app that is easy to use - particularly avoiding problems with the unsteady hand. Secondly, I'd like an app that passes variable to the Webwork problem.

What I envision for a simple problem: Draw a sinusoid of s(t)=A Cos(wt+phi)+b,
where the students creates a graph in a GUI with four sliders, one each for A,w,phi , b (I'll not even label the sliders but let the student figure out which slider goes with which parameter. The student adjusts the sliders until s/he thinks the graph is correct and hits "submit". The values of the sliders are transmitted to the Webwork problem for evaluation. If they are not sufficiently close, the problem is marked incorrect with a note indicating which parameters are close enough and which are not. The parameters are resent to the GUI (if they cannot be saved across executions of the app and the student modifes the graph via the sliders and tries again.

How do I get communication between the app (java, python, flash), so the student can continue work on the same problem? The examples I've seen so far of sketching send a right or wrong values and then create a new problem. I'd like interaction with the app - is that possible?

thanks
In reply to Joel Trussell

Re: Interactive graphics

by Michael Gage -
Hi Joel,

At this point in web development I don't recommend using java, python, or flash to develop web applets. Some version of javaScript (aka html5) is probably the way to go and is actually easier to interface with WeBWorK than java or flash applets which still have to use javaScript to communicate with WeBWorK.

I think the easiest approach might be to design the interface using GeoGebra and then connect it to WeBWorK. I've attached a very rough GeoGebra app, let me know if this is approximately what you have in mind. It works made with Geogebra 5. For now you'll need to grab Geogebra 5 and run it from your desktop.

Other options might be JSXGraph, D3.js. There are more options at
https://github.com/mathjax/MathJax-docs/wiki/List-of-general-purpose-graphics-javascript-libraries


-- Mike


In reply to Joel Trussell

Re: Interactive graphics

by Michael Gage -
Here is another example to look at:


You can log in as guest. See screen shot which I've uploaded with this post.
It shows a free form geogebra applet which you can play with much like regular geogebra.

You can create your sine curve by clicking on the menu (triple bars in the right corner, then on View, and then choose Input bar. ) This will display the input bar at the bottom which I have filled in with y=5sin(3x+2). You can also create sliders a=slider(-5,5) and then use them in the equation.

Clicking on "Show Problem Source" in the upper right hand corner shows the webwork code for the problem. It will detect the positions of points A and B when they are placed on the geogebra applet. You can see how that code works and do something similar to detect the values of sliders a and b and c.


Attachment WeBWorK_BMCC101_geogebra_6.png
In reply to Michael Gage

Re: Interactive graphics

by Joel Trussell -
I played with the example as a guest and copied the code to my machine. It looks like it works here. So, I'll play and get back to you
Thanks
In reply to Michael Gage

Re: Interactive graphics

by Joel Trussell -
I've worked with this example and can create the sinusoid generator with sliders. I downloaded the code and worked with it on my server. I can't determine how to save that configuration or generate it using the command structures of the example. (I located a page "Steps to contruct the GeoGebra applet" but this uses javascript, with which I'm not familiar yet. I located the slider command
https://wiki.geogebra.org/en/Slider_Command
but could not figure out how to insert it in the code of the example. In fact, I couldn't see how to set the position of the slider in the commands. I think there is some remedial reading that I should be doing. Any suggestions?
In reply to Joel Trussell

Re: Interactive graphics

by Michael Gage -
You can copy the configuration to the base64 format using the key commands:
Control-shift-B (on a Mac use Cmd-shift-B). This copies the configuration to the clipboard.

Control-shift-M (or Cmd-shift-M) will copy a full html framework (including the base64 string) to the clipboard. This can be useful in preparing a geogebra applet for use in a webwork problem since there is not so much overhead while debugging.

https://wiki.geogebra.org/en/Keyboard_Shortcuts

If you can post your geogebra applet and your current .pg problem up on your github site then I can fork a copy and can help tweak it so it works. There are others, particularly at BMCC who are even more expert at this point in creating this kind of applet.
In reply to Michael Gage

Re: Interactive graphics

by Joel Trussell -
I can get the base64 code using ctrl-shift-b. I can't get the html using ctrl-shift-m. I looked online and found pages that said there was an export command under file that is supposed to export the html code
https://wiki.geogebra.org/en/File_Menu
but it does not show on my desktop GeoGebra app or on the file that I generate using GeoGebra online.
CAn you use the base65 code?
I'll take the example you gave me that displays the GeoGebra window and write my draft of the pg problem, leaving the code that you used to insert the GeoGebra window.

In reply to Joel Trussell

Re: Interactive graphics

by Michael Gage -
The problem with Ctrl-shift-M could be a problem with the version of Geogebra. There were reports several years ago that Ctrl-shift-M didn't work with early versions of Geogebra 5. My version is GeoGebra 5.0.271.0.

You can use the base64 code. For an example of how to do this look at:

https://hosted2.webwork.rochester.edu/webwork2/BMCC101/geogebra/4/

In
sub GEOGEBRA_PARAMS { my $result = { showResetIcon=>"false" , enableRightClick=>"false" , enableLabelDrags=>"false", showMenuBar=>"false" , showToolBar=>"false", showAlgebraInput=>"false", useBrowserForJS=>"true", ggbbase64=>"UEsDBBQACAAIAHZv00IAAAAAAAAAAAAAAAAWAAAAZ2VvZ2VicmFfamF2YXNjcmlwdC5qc0srzUsuyczPU0hPT/LP88zLLNHQVKiu5QIAUEsHCEXM3l0aAAAAGAAAAFBLAwQUAAgACAB2b9NCAAAAAAAAAAAAAAAADAAAAGdlb2dlYnJhLnhtbN1Y65PTNhD/fPwVO/58l0iW5QeTwARmmNIBhunRDu03xVYScY7l2sqL4Y/vSrITJ1egcPepdySrx2p3f/uSjsnz/bqErWxapatpQEckAFnlulDVchpszOImDZ4/ezJZSr2U80bAQjdrYaZBNAqD0zmcjaLEHlbFNFjkMYvnKblJRM5vonxBb+YLxm/CMCsymhaSkTgA2LfqaaXfibVsa5HL23wl1+KNzoVxMlfG1E/H491uN+q1j3SzHC+X89G+LQJAy6t2GnSDpyju7NCOOfaQEDr++PaNF3+jqtaIKpcBWFQb9ezJ1WSnqkLvYKcKs5oGnLMAVlItVwgzTrMAxpapRqy1zI3ayhaPDqYOs1nXgWMTld2/8iMoj3ACKNRWFbKZBmTEYhqjj3iYkjDNGCrUjZKV6Xhpp3PcS5tsldx5sXbkNEYkSzAEqlXzUqLTRdkiKlUtGvQoGtRscNqaQynnounnJ3voNf4ig/osrSwMnXfDNGCMXafZdULINefEmzLUG4DRunRCCfAMvnyBkIQEri2hnoRI4thvEb9GmCehJ5En3PNE/njkWSPPE3meiH0DZjc/4ewWzoD2MNkQJkV89hPjx+G/wJkOcFIL4gtQa70jDKzd1NlvSdRNYz9NHKHEE9ptpvbL+St+ICL2U4joQKtPh68rvZcuvUYexv9dY/ggnEeU4b+hDPlXUD7Qub1SygdKUZf75z73VLIfwvlV1/6Axjh6SOn/hMKEnJV9X/Oe0o5+yw2PZtRk3DfDSWcQtCvL26W0kevWmsgy15yAAsfijRPsJRxohiSxRRwC5RBxnNIUYksTYLZuI2CQguWjDFwL4il+Ra6mY+Aoyy4mvriBRcAZUNe4IkAvgGt+6JOQIQfnwPGQ1U6tWhZDFOOEpRChgbbtJba1MDyHc1QeAqPA7FmaQBhDHEJiWyeNbEeNU2s7Cg0hJhDbo9g7sW/6noknUmAWDVZBrVt1dO5KlvUxKs6Pqqo35sx3+broh0ZfcBc6v3tx4WspWtOPkQnvq9Ot6O+vs0vzalKKuSzxaXFr0wBgK0pb5U7+QlcG+hQI/dqyEfVK5e2tNAZPtfBJbMUbYeT+FXK3vYFOtbvLJ3KTl6pQovoDc8SKsALheLXb3tVf7TyMvJZc66a4PbSYOLD/SzYaG04c2cfMoZvxbJQNfzBVc2GTPIxH4dkOluXhtIfdefCTenVye4Qj9rLt/bdsVDEcv25f6LI4xqDWqjIvRW02jXuaYW9sLI5ZtSylc6eLMj5y8ru53t96PzIv68Ohxhnx+ufLl7rUDTQWGEeGjs49dTzWsCMXcTzEcZA+MKo47tMsdByOzj11XBhpb1oHlPYoSa9FteDnZ2nlssS+mDaVMm/6iVH53Qmo5X+3Wc8xwbpj5yLpo4m0JuPbrTUfu/exHf85GH9YSSPsq46HjGdpknD8DrM09Yl5kZKTO9lUsvSJV2EebPSm9ZVwzOaryaaV74VZzariN7nEEn4vbBc1aJpnPZlXyFyt8aBf7zwvbFb8jlD9aiGXjew9VLqntI+L2yXDMri37ES9avT6dbX9gCl3Yepk3OOZtHmjapvYMMe2fidPyYteEngpFMNzCL5FFLltUBgIY4MQgNiYlW7caxnL3OYS/LrBd3RIMJdtfZdyje9kMC6jXVEcgztzD3AbRdDzT9h1LoJ/8hlu36uBPr9BlPXKhbNzQCkOsjlziZP3VheXjsI4ODTYSWorwOZULaXPRm8xDmoU6Ep4EG7n+xb2Xi0cOvrZZ5n/+8NitWXtlfLh6kXQMOe8m77jsBf/J4exR3JYrtdrURVQuVfLS9XkpQxO16UgNtFAUOs+75uN6TdyL6wTcc/7mPIqP3o3/473B2iH7ieP4/xTbzZ4w97hn5mte66b7qpwg19UUUj3fPA3l1rKaouWamxDsCddDzyQPl37lT1658YHhnZLn+kgNBj2Ru1h1vPPeq5ZiAczN2Kd0FnUy5rxbuSN+bvy9re+gdt3hlqo/DKe42GjcQ+F7j8Tnv0DUEsHCGGlsenwBQAA/BAAAFBLAQIUABQACAAIAHZv00JFzN5dGgAAABgAAAAWAAAAAAAAAAAAAAAAAAAAAABnZW9nZWJyYV9qYXZhc2NyaXB0LmpzUEsBAhQAFAAIAAgAdm/TQmGlsenwBQAA/BAAAAwAAAAAAAAAAAAAAAAAXgAAAGdlb2dlYnJhLnhtbFBLBQYAAAAAAgACAH4AAACIBgAAAAA=" };

you can replace the string for ggbbase64 with
the string you captured using ctrl-shift-B.
(the string needs to be inside quotes).

The base64 string replaces most of the xml specifying the geogebra state which is
what was used in geogebra/6/ on the hosted2 site.


In reply to Michael Gage

Re: Interactive graphics

by Joel Trussell -
Mike,

very helpful. We've got something close to complete. The codes are in
https://github.com/hjtrussell/geogebra_webwork_tests

currently we place the sliders in the base64 code, but we'd like to place them in random order. Not a big deal but it makes the students' problem more different.

Thanks
In reply to Joel Trussell

Re: Interactive graphics

by Michael Gage -
Looks good. Seems like you're able to do most of what you were asking for and this is a good base for similar problems.

I believe there are commands for placing slider bars in the description of geogebra's JS interface. You can construct a <script> </script> segment that creates these codes in webwork and then print that to the webwork page using TEXT() to create the objects dynamically.

I'm at the joint math meetings (JMM) at the moment . I'll be back in Rochester next Monday